Breastfed and formula-fed babies gain weight at about the same pace for the first few months. After about 3 months, breastfed babies usually gain more slowly, so by their first birthday they tend to be a little lighter and leaner, while their length and head size keep pace. In the DARLING study, breastfed babies gained 0.65 kg (about 1 lb 7 oz) less over the first year than formula-fed babies (Dewey et al., 1992).
That difference is normal, and it's a main reason the WHO growth standards were built from breastfed babies. The CDC recommends those WHO charts for every baby in the US from birth to age 2, however they're fed (CDC). For any baby, what matters most is how their own curve looks over time.
Do formula-fed babies gain weight faster?
After the first few months, on average, yes. The best-known comparison is the DARLING study in Davis, California. It matched breastfed and formula-fed babies for their parents' socioeconomic status, education, ethnic group and body size, and for the babies' sex and birth weight. Neither group had solids before 4 months (Dewey et al., 1992).
- First 3 months: weight gain was similar in both groups.
- Rest of the first year: breastfed babies gained more slowly and weighed less than the formula-fed group from 6 to 18 months.
- Length and head size: similar in both groups throughout.
- Body fat: formula-fed babies had more weight for their length from 7 months and more estimated body fat from 5 to 24 months. Breastfed babies took in less energy, which explained the difference (Dewey et al., 1993).
The CDC sums up the wider research the same way: healthy breastfed babies typically gain faster than formula-fed babies in the first few months and more slowly for the rest of infancy, and slower growth between 3 and 18 months is normal (CDC).
DARLING was small (46 breastfed and 41 formula-fed babies by 1993) and compared babies fed one way for a full year, so it describes the two ends of the range, not babies who get some of each.
GrowthKit for iPhone
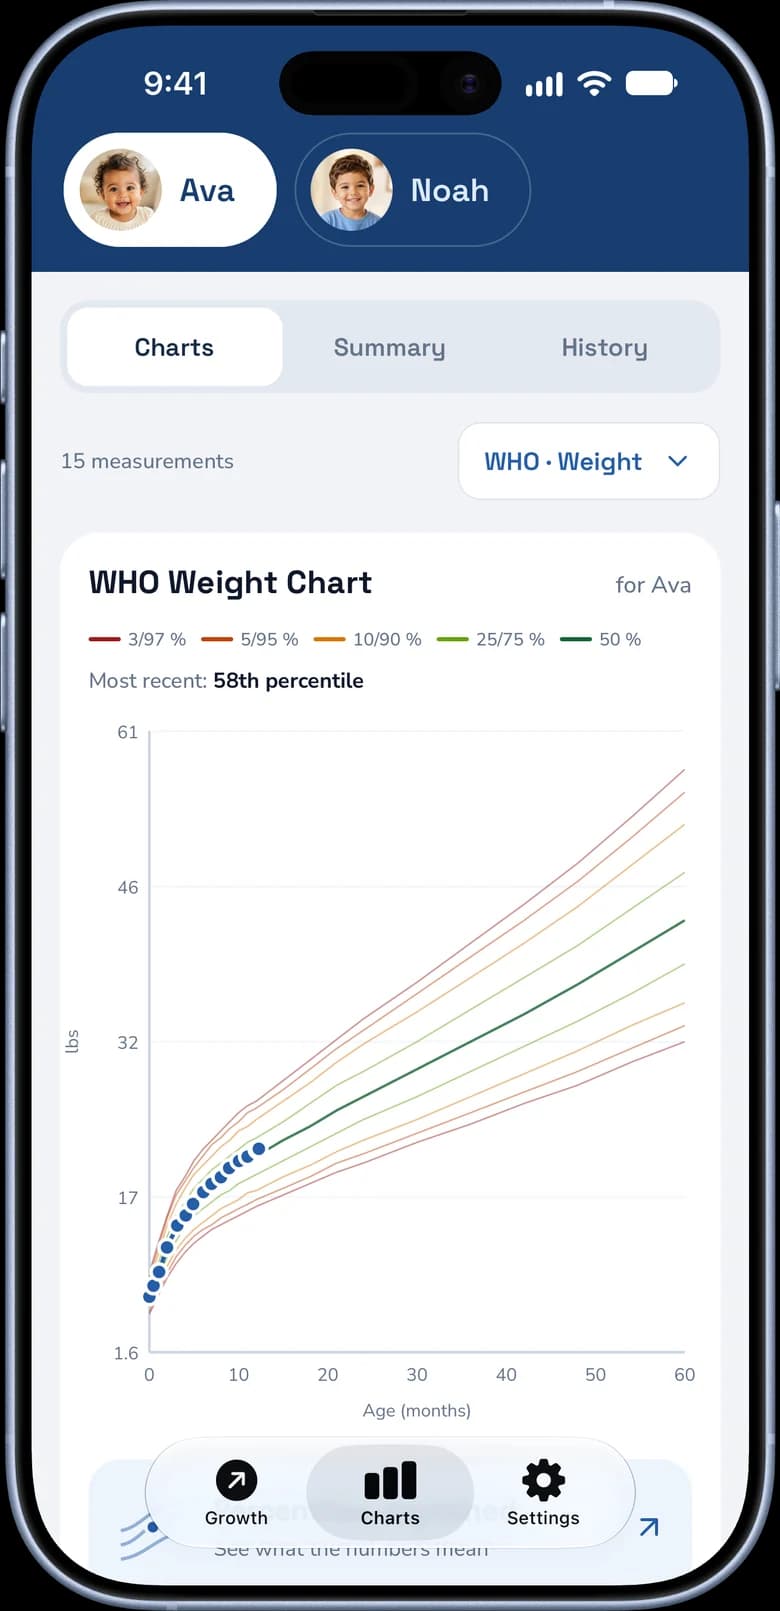
Plot every measurement on the WHO charts.
Percentiles, growth velocity and a PDF for your pediatrician. Free to download, with a free trial.

Why the WHO charts are based on breastfed babies
The older international growth reference came from US infant data in which almost all babies were formula-fed (CDC). In 1995, a WHO working group found that healthy babies fed as WHO recommended grew differently from that reference, which could make it harder to time solid foods well (WHO Working Group on Infant Growth, 1995).
The answer was the WHO Multicentre Growth Reference Study in Brazil, Ghana, India, Norway, Oman and the US. The infants the charts are built on were breastfed for 12 months and predominantly breastfed for at least 4 months (CDC), with lactation counselors visiting often in the first months (WHO MGRS Group, 2006). That makes the healthy breastfed baby the standard every other baby is compared with (more in our WHO Child Growth Standards guide).
The CDC recommends these charts for all US children under 2 "regardless of type of feeding" (CDC). Measuring a formula-fed baby against the same standard is a choice of yardstick, not a judgment about formula.
What the difference looks like on a growth chart
An example breastfed boy on the WHO weight chart:
Weight-for-age, boys, birth to 12 months
He's at the 54th percentile at birth and the 50th at 4 months. Then his gain slows: the 44th at 6 months, the 38th at 9 months and the 37th at 12 months. His length at 12 months, 75.7 cm (29.8 in), is at the 49th percentile. He has settled just below the median line, well above the 15th: the DARLING pattern of same length, a little less weight.
On the older CDC infant chart, the same boy would look as if he were sliding. Those charts came from US surveys in which only about a third of babies were breastfed for 3 months or more (CDC, 2000). The CDC notes that babies still breastfeeding at about 3 months tend to keep their percentile on the WHO charts but fall on the CDC charts, which could lead a clinician to suggest formula or weaning that isn't needed (CDC). At home, use a WHO-based chart or calculator until age 2 (see WHO vs CDC growth charts).
Formula-fed babies show the mirror image on the WHO chart. In the first few months they may look as if they're gaining a little slowly, which the CDC calls typical for formula-fed babies; after about 3 months they tend to climb (CDC).
Free tool
Baby Weight Percentile Calculator
See your baby's weight percentile on the WHO standards used for every US baby under 2.
Weight loss in the first week
Feeding type shows up right after birth too. In a Scottish study of 937 healthy term newborns, breastfed babies lost a median of 6.6% of their birth weight and formula-fed babies 3.5%. Breastfed babies were back to birth weight at a median of 8.3 days, formula-fed babies at 6.5 days (Macdonald et al., 2003).
The same limits apply to every baby: a well-fed newborn loses no more than about 8–10% of birth weight, and a loss of 10% or more needs a feeding check (AAP). Still being below birth weight at 2 weeks is a reason to call your pediatrician (AAP). More in newborn weight loss after birth.
Faster gain and later weight
Climbing steadily up the chart in the first two years is linked with later weight, whatever the feeding method. Children whose weight rose by more than 0.67 SD between birth and age 2 (roughly from the 50th to the 75th percentile) were heavier and had more body fat at age 5; those who climbed tended to have been smaller at birth (Ong et al., 2000). In a pooled analysis of 47,661 people from 10 cohorts, each 1 SD rise in weight in the first year roughly doubled the odds of childhood obesity (Druet et al., 2012). These are associations, not proof that feeding caused the gain. For a baby who has always tracked high rather than climbed, see when a high percentile is normal.
How milk is given may matter as well as what the milk is. In a CDC study of 1,250 US babies, those who were bottle-fed more in early infancy were more likely to empty the bottle or cup later in infancy, whether the bottle held formula or expressed breast milk (Li et al., 2010).
What helps, for any baby:
- Follow your baby's cues. A baby who gets fidgety or distracted during a feed is probably finished (AAP). There's no need to finish every bottle.
- Mix formula exactly as the label says. Too much water may mean formula doesn't meet your baby's nutritional needs (CDC).
Combination feeding: which pattern to expect?
Many babies get both breast milk and formula. There's no separate chart for combination feeding; the WHO charts apply to all babies under 2. Research mostly compares babies fed mainly one way, so there's no well-defined "mixed-feeding curve". Judge your baby's chart like any other: a steady track along roughly one line, with length keeping pace. To see that track, plot your baby's dated weights on the WHO chart.
If formula is being added because a breastfed baby is gaining slowly, the CDC advises doctors to first check the baby's general health and how breastfeeding is going, and to consider supplementing only when there's evidence that milk intake is falling short (CDC). For amounts, see how much formula to feed and is breast milk enough?
When slow gain isn't about feeding type
Feeding type explains a gentle drift in weight after about 3 months. It doesn't explain weight loss, slowing length or head growth, or weight falling across two major percentile lines, the usual trigger for an evaluation (AAFP). Our guide to why weight gain slows after 6 months has more examples.
| What you see | What to do |
|---|---|
| Gain slows after 3–4 months, but your baby stays near one line, length keeps pace, and feeds and diapers are normal | Nothing extra; keep to well-child visits |
| Weight has crossed one major line downward | Mention it at the next visit |
| Still below birth weight at 2 weeks, or not gaining at least 5–7 oz (140–200 g) a week after that | Call your pediatrician |
| Weight falling across two major lines, or weight low for length | Call and book a weight check |
| Length or head size slowing as well as weight | Ask your pediatrician to review the chart soon |
| Far fewer wet diapers, repeated vomiting, refusing feeds, or unusually sleepy or unwell | Call your pediatrician now |
Source: AAP: Warning signs of breastfeeding problems; AAFP: Failure to thrive (2016)
GrowthKit plots weight, length and head circumference on WHO charts, with growth velocity, so you can tell a gentle drift from a steeper fall. A note on a measurement, such as "started formula top-ups", shows later how the curve changed.
Free tool
Baby Weight Growth Velocity Calculator
Enter two weights and dates to see your baby's gain per week and per month.