
To calculate a child's growth percentile, look up three numbers (L, M and S) for the child's age and sex in the WHO or CDC reference tables. Turn the measurement into a z-score with z = ((X ÷ M)^L − 1) ÷ (L × S), then convert the z-score to a percentile using the normal distribution. For example, a 6-month-old boy who weighs 8.4 kg (18 lb 8 oz) has a z-score of about +0.52 on the WHO weight-for-age standard. That puts him at the 70th percentile.
This is the LMS method (Cole & Green, 1992), and it's how the WHO and CDC tables, and our own calculators, produce percentiles. Below is the whole calculation, with real WHO values, so you can check any number yourself.
The quick way: use a calculator
If you just want the answer, a calculator does all four steps for you. Our free online calculators use the official LMS data:
- Under 2 (WHO): baby weight percentile, baby length percentile, head circumference percentile and weight-for-length.
- Ages 2 to 5 (WHO): toddler weight percentile and toddler height percentile.
- Older children (CDC): child BMI percentile, child height percentile and child weight percentile.
For an overview of all the tools, see our pediatric growth chart online guide. If you want z-scores instead of percentiles, you can get WHO z-scores for every measurement from birth to age 5.
Step 1: Choose the right reference
The percentile depends on which reference you compare against, so pick it first.
| Reference | Ages covered | Built from |
|---|---|---|
| WHO Child Growth Standards (2006) | Birth to 5 years | Healthy, breastfed children in six countries, measured 1997–2003 |
| WHO Growth Reference (2007) | 5 to 19 years (weight-for-age to 10) | The 1977 NCHS data, supplemented with WHO under-5 data |
| CDC 2000 Growth Charts | Birth to 36 months and 2 to 20 years | US national health surveys, 1963–1994 |
Source: WHO Child Growth Standards; WHO 5–19 reference; Kuczmarski et al. 2002.
In the US, the CDC recommends the WHO charts from birth to 24 months and the CDC charts from age 2 (CDC). Many other countries use WHO throughout childhood. So plotting a 5-year-old on a WHO chart isn't wrong, but the result won't match the CDC chart a US pediatrician uses. The GrowthKit app, for example, plots height and weight on WHO charts at every age and uses the CDC reference only for BMI. Whatever you choose, compare measurements on the same reference over time.
Step 2: Look up L, M and S
Growth measurements aren't perfectly bell-shaped (weight, in particular, is skewed), so a single average and standard deviation can't describe them. The LMS method uses three values for each age and sex (Cole & Green, 1992):
- L (lambda): a power that corrects for skewness.
- M (mu): the median.
- S (sigma): the coefficient of variation, which describes the spread.
The WHO built its standards with a more general method (Box-Cox power exponential), but none of the length, weight or BMI standards needed its extra kurtosis term, so the standard L, M and S formula applies (WHO MGRS Group, 2006). The CDC publishes the WHO values in downloadable data files, and the WHO offers expanded tables on its standards pages.
For our example, a boy aged exactly 6 months, the WHO weight-for-age values are:
| Value | WHO weight-for-age, boys, 6 months |
|---|---|
| L | 0.1258 |
| M | 7.9341 kg |
| S | 0.10958 |
If the child is between whole months, use values for their exact age. Calculators interpolate between the published values.
Step 3: Calculate the z-score
The formula is:
z = ((X ÷ M)^L − 1) ÷ (L × S)
where X is the measurement. For our 8.4 kg boy:
- Divide the weight by the median: 8.4 ÷ 7.9341 = 1.05872
- Raise that to the power L: 1.05872^0.1258 = 1.00720
- Subtract 1: 1.00720 − 1 = 0.00720
- Multiply L by S: 0.1258 × 0.10958 = 0.01379
- Divide step 3 by step 4: 0.00720 ÷ 0.01379 ≈ 0.52
His weight is about half a standard deviation above the median. Two special cases simplify the formula:
- When L = 0: z = ln(X ÷ M) ÷ S.
- When L = 1: z = (X ÷ M − 1) ÷ S. WHO length and height tables use L = 1 because length is normally distributed. Our WHO growth standards guide works through a length example.
Step 4: Convert the z-score to a percentile
The percentile is the share of a standard normal distribution that falls below z, times 100. In Excel or Google Sheets, =NORM.S.DIST(0.5226, TRUE) returns 0.6994 (we've kept an extra decimal of z here). Our boy is at the 70th percentile, which matches our calculator: 70th. Roughly 70 in 100 healthy 6-month-old boys weigh less than he does.
Without a spreadsheet, this table gets you close:
| z-score | Percentile |
|---|---|
| −3.0 | 0.1st |
| −2.0 | 2.3rd |
| −1.5 | 6.7th |
| −1.0 | 15.9th |
| −0.5 | 30.9th |
| 0 | 50th |
| +0.5 | 69.1st |
| +1.0 | 84.1st |
| +1.5 | 93.3rd |
| +2.0 | 97.7th |
| +3.0 | 99.9th |
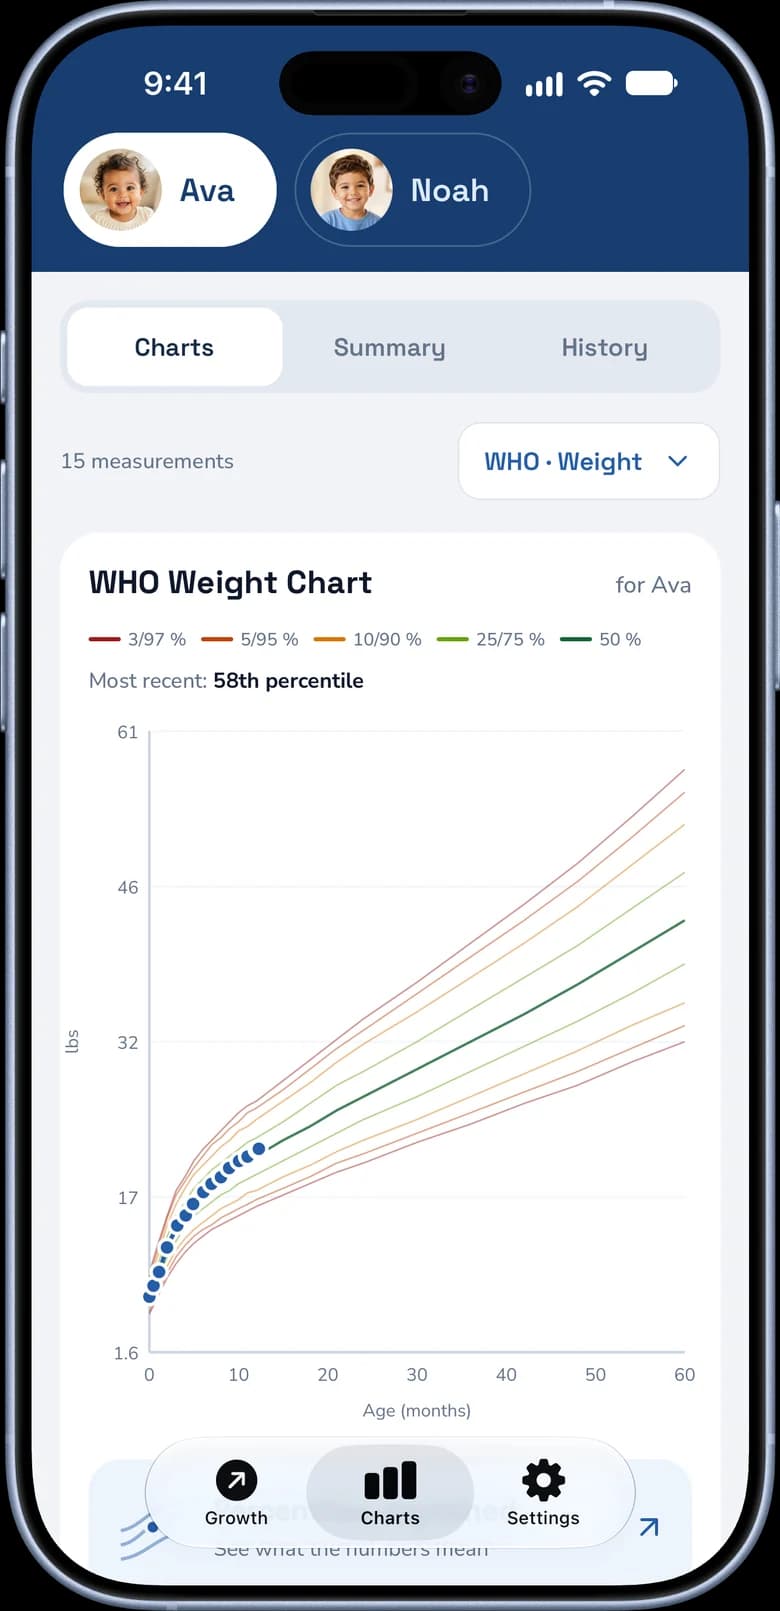
GrowthKit for iPhone
Plot every measurement on the WHO charts.
Percentiles, growth velocity and a PDF for your pediatrician. Free to download, with a free trial.

Second example: a BMI percentile on the CDC chart
From age 2, US pediatricians judge weight for height with BMI-for-age on the CDC chart. The method is the same, with one extra step at the start.
Take a boy who is exactly 4 years old, weighs 16.8 kg (37 lb 1 oz) and is 104 cm (40.9 in) tall.
- BMI: 16.8 ÷ (1.04 × 1.04) = 15.5. In US units: 703 × pounds ÷ inches², or 703 × 37.04 ÷ (40.94 × 40.94) ≈ 15.5.
- CDC BMI-for-age, boys, 48 months: L = −1.6843, M = 15.6406, S = 0.07181.
- z-score: (15.5 ÷ 15.6406) = 0.99101; raised to the power −1.6843, that's 1.01533; minus 1 gives 0.01533. L × S = −0.12095. So z = 0.01533 ÷ −0.12095 ≈ −0.13.
- Percentile: about the 45th.
On the CDC's categories, the 5th to below the 85th percentile is a healthy weight, so he's well within it. Note that L is negative here. BMI has a long tail of high values, more skewed than infant weight, and a negative L is how the formula corrects for that.
Free tool
Child BMI Calculator
Calculate BMI and the CDC BMI-for-age percentile for children aged 2 to 20.
Common mistakes that change the answer
- Rounding the age. Infants grow fast, so age matters to the month. The same 8.4 kg boy is at the 85th percentile at 5 months, the 70th at 6 months and the 55th at 7 months. Use the exact age in months (or days).
- Mixing up length and height. Under 2, children are measured lying down (length). Length runs about 0.7 to 0.8 cm longer than standing height (CDC), so using the wrong one shifts the percentile.
- Using the wrong sex. Boys are heavier and longer on average, so a girl plotted on a boys' chart looks smaller than she is.
- Mixing units. Convert pounds to kilograms (divide by 2.2046) and inches to centimeters (multiply by 2.54) before using metric LMS tables.
- Forgetting corrected age. For babies born early, subtract the weeks born early from their age, usually through age 2.
- Comparing across charts. A WHO percentile at 18 months and a CDC percentile at 30 months aren't directly comparable. A change may reflect the chart, not the child.
Reading a percentile from a printed chart
You can estimate a percentile without any math. Find the age on the bottom axis and the measurement on the side axis, and see which curved lines the point falls between. If it sits halfway between the 50th and 85th lines on a WHO chart, the percentile is somewhere in between, roughly the 60s to 70s. This is fine for spotting trends, but it can't give you an exact number. Our guide on how to read a child growth chart walks through it with an example.
What to do with the result
- A percentile is a rank, not a score. Any steady line from the lowest to the highest on the chart can be healthy. See what does my baby's percentile mean?
- Know the cutoffs. Under 2, the CDC recommends flagging values below the 2.3rd or above the 97.7th percentile on WHO charts (CDC). From 2, BMI-for-age below the 5th percentile is underweight, the 85th to below the 95th is overweight, and the 95th or above is obesity (CDC).
- Watch the trend. Falling across two major percentile lines matters more than any single number.
- Use z-scores at the extremes. Below the 1st or above the 99th percentile, percentiles bunch together, and the z-score shows progress more clearly.
A calculated percentile helps you follow your child's growth. It doesn't diagnose anything. If the numbers worry you, bring them to your pediatrician.