Yes. From birth to age 5, the WHO growth standards work for children of every ethnicity, including Asian and Indian babies. In the WHO's six-country study, healthy, well-nourished children in Brazil, Ghana, India, Norway, Oman and the US grew remarkably alike: only about 3% of the variation in children's length came from which country they lived in, compared with 70% from differences between individual children (WHO MGRS Group, 2006). The CDC notes that the most important influences on growth potential appear to be economic, nutritional and environmental (CDC).
The picture gets more detailed for older children and adults. Some countries use their own charts after age 5, average adult heights differ between countries, and your child's own parents' heights matter a great deal. Here's how it fits together.
What the WHO six-country study found
The WHO Multicentre Growth Reference Study (MGRS) measured 8,440 children "from widely differing ethnic backgrounds and cultural settings" between 1997 and 2003 (WHO MGRS Group, 2006). The sites were Pelotas (Brazil), Accra (Ghana), Delhi (India), Oslo (Norway), Muscat (Oman) and Davis, California. Each enrolled families whose living conditions didn't hold growth back, with healthy term babies, breastfeeding and mothers who didn't smoke (CDC).
The study started from a hypothesis based on earlier research: that all young children can grow similarly, whatever their ethnic group or place of birth, if they're healthy and well fed. The data confirmed it. Average lengths of children under 2 at the six sites were virtually identical (CDC), and most differences between sites were smaller than 0.2 standard deviations (WHO MGRS Group, 2006).
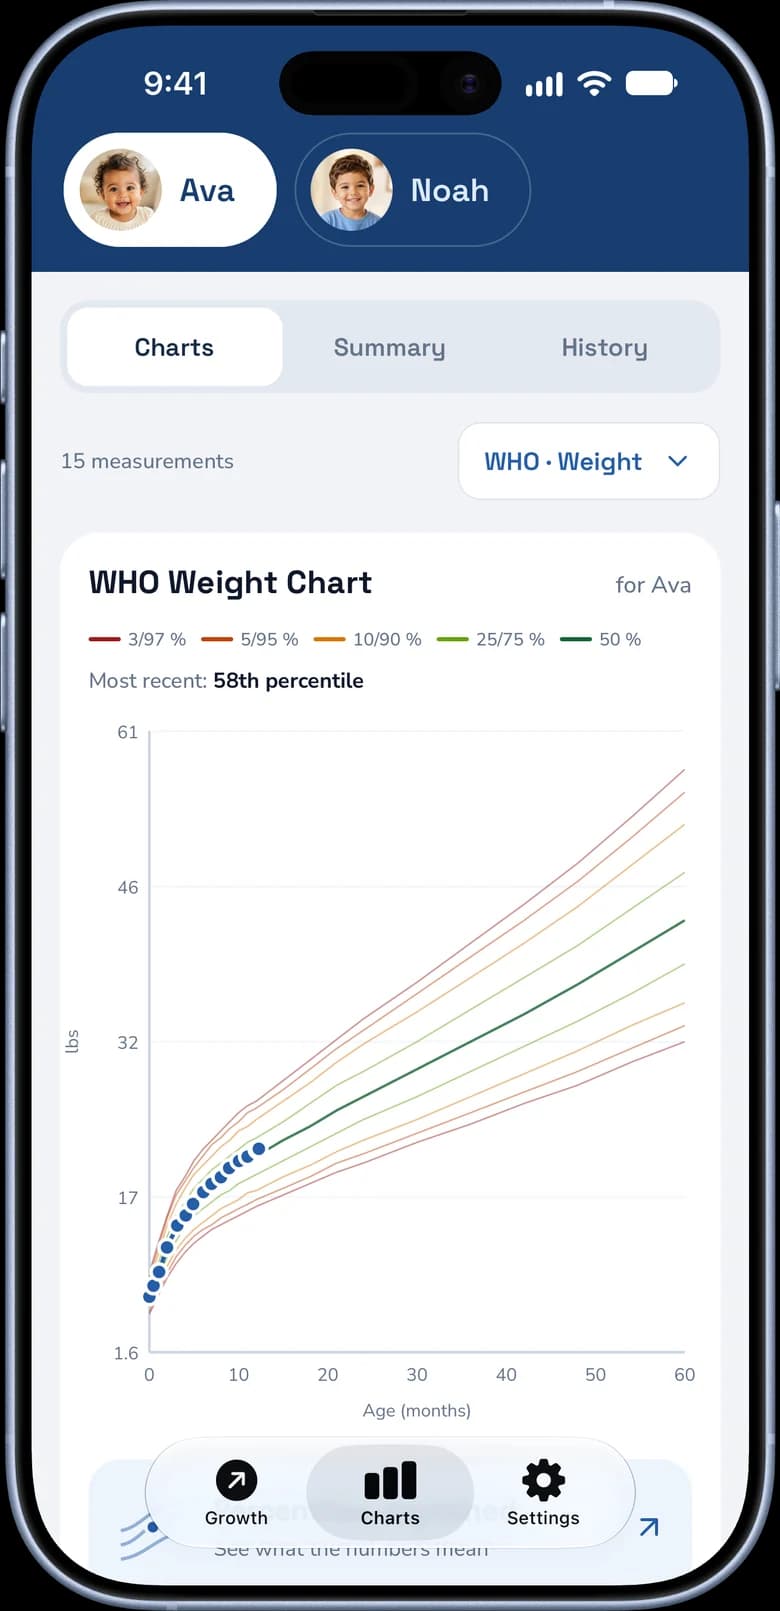
So the WHO pooled the six sites into one standard, which it says "can be used to assess children everywhere, regardless of ethnicity, socio-economic status and type of feeding" (WHO MGRS Group, 2006). By April 2011, 125 countries had adopted the WHO standards; among those that hadn't, the main reason was a preference for local references (de Onis et al., 2012). For how the study worked, see our guide to the WHO Child Growth Standards.
GrowthKit for iPhone
Plot every measurement on the WHO charts.
Percentiles, growth velocity and a PDF for your pediatrician. Free to download, with a free trial.

Is there a separate growth chart for Asian or Indian babies?
Not for babies and young children. Here's how three countries handle it:
- India: The Indian Academy of Pediatrics (IAP) recommends the WHO standards for children under 5 and its own 2015 charts for ages 5 to 18 (IAP, 2015). The IAP charts use data from 33,148 healthy children from middle- and upper-income families in 14 Indian cities. Because Indians face a higher risk of obesity-related heart and metabolic problems at a lower BMI, the IAP's BMI charts mark overweight and obesity at lines equivalent to an adult BMI of 23 and 27 (Khadilkar & Khadilkar, 2015).
- United Kingdom: England has used the UK-WHO charts for all babies born since May 2009 (UK Department of Health, 2009). They're based on the WHO standards, and the Royal College of Paediatrics and Child Health says they're suitable for babies and children from all ethnic backgrounds (RCPCH).
- United States: Pediatricians use WHO charts from birth to 2 and CDC charts from age 2. The CDC 2000 charts include US children of every race and ethnicity, because the differences in size between the major racial and ethnic groups "appear to be small and inconsistent" (CDC, 2000).
So whatever your family's ancestry, the chart your pediatrician uses for a baby or toddler is designed to fit your child.
Why US pediatricians use WHO charts under age 2
The CDC recommends the WHO standards for all US children under 2 (CDC). Its reasons include:
- They're a standard, not just a reference. They describe how healthy children grow in good conditions, rather than how one group of children happened to grow.
- They treat breastfeeding as the norm, in line with the recommendation that breastfeeding is the standard for infant feeding. See breastfed vs formula-fed baby growth for what that means on the chart.
From age 2, pediatricians switch to the CDC charts. Our WHO vs CDC growth chart guide explains why a percentile can shift at that visit.
When do differences between populations show up?
Mostly later in childhood and in adult height. Researchers who pooled height data on 18.6 million people born between 1896 and 1996 in 200 countries found a gap of 19–20 cm (about 8 in) between the tallest and shortest populations a century ago, and it hasn't narrowed. Heights also changed fast within countries: over that century, South Korean women became 20.2 cm taller on average and Iranian men 16.5 cm taller. The researchers note that while height is highly heritable within a population, differences between countries are believed to come mainly from non-genetic factors, such as growth before birth and nutrition and infections during childhood (NCD-RisC, 2016).
A follow-up study of 65 million school-aged children and teenagers found that by age 19, average height differed by 20 cm or more between the tallest and shortest countries. Children in some countries started school at a healthy height but fell behind their peers elsewhere as they grew, which the researchers say reflects differences in nutritional quality (NCD-RisC, 2020).
Not everyone agrees that one chart fits every measurement equally well. A 2014 systematic review of well-off children from 55 countries or ethnic groups found average heights generally within 0.5 SD of the WHO means. Head circumference varied more, though: in many groups average head size was 0.5–1 SD above the WHO mean, and the authors argued that a single international head-size standard could lead to misdiagnosis (Natale & Rajagopalan, 2014). That's one more reason pediatricians look at the trend in head growth rather than one measurement (see our baby head circumference chart).
Your child's genes: why parents' height matters
Within a family, genes matter a lot. Scientists estimate that about 80% of an individual's height is determined by inherited genetic variation (MedlinePlus). That's why a healthy child can settle on a lower or higher line than average. If your baby sits on a low line, see when a small baby needs a closer look.
Size at birth mostly reflects conditions in the womb. Over the first 18 months or so, many children then drift up or down the chart: some move up because their parents are tall, others move down because their parents are short. By 18 to 24 months, most children have reached their genetically determined percentile and then follow it until puberty (AAFP).
Here's an example girl whose parents are both on the shorter side, plotted on the WHO length/height chart:
Length/height-for-age, girls, birth to 5 years
She's born at the 51st percentile, drifts to the 22nd at 12 months and the 17th at 2 years, then holds that line: the 16th at 3, the 16th at 4 and the 17th at 5. Her mother is 155 cm (5 ft 1 in) and her father 170 cm (5 ft 7 in). Her mid-parental height, (155 + 170 − 13) ÷ 2, is 156 cm (5 ft 1½ in), about the 13th percentile for adult women on the CDC chart. Her steady track just above the 15th line fits her family. Learn how the formula works in how to predict your child's adult height.
Free tool
Child Height Prediction Calculator
Estimate your child's adult height from both parents' heights with the mid-parental formula.
When to talk to your pediatrician
Ancestry shouldn't be used to explain away a real change in growth. The same signs matter for every child:
- Crossing lines. Weight or height falling across two major percentile lines on the chart your pediatrician uses.
- Crossing after age 2. Children who cross percentiles after 24 months, or grow below the 3rd percentile, should be evaluated (AAFP).
- Growth that doesn't fit the family. A child tracking well below where both parents' heights would put them.
- Past hardship. Children adopted from abroad, or who've lived through food shortages, may start low and catch up; see our adopted child growth chart guide.
GrowthKit plots weight, height and head circumference on the WHO charts (weight to age 10, height to 19, head circumference to 5) and uses the CDC reference for BMI from age 2. If your child's doctor uses national charts, such as the IAP charts for Indian children aged 5 to 18, the app's percentile may differ a little from theirs. Neither is wrong; compare trends on the same chart.
Free tool
Baby Length Percentile Calculator
See your baby's length percentile on the WHO standards, which fit babies of every ancestry.