A baby who stays on a low percentile line, such as the 5th or 10th, and keeps growing along it is usually a healthy small baby. Pediatricians look past the number itself to three things: the trend over several visits, whether weight is in proportion to length and head size, and the cutoff. On the WHO charts US pediatricians use under age 2, the line labeled 2nd (really the 2.3rd percentile) marks unusually low growth (CDC).
What does prompt a closer look is a baby who got to a low percentile by falling across lines, or whose weight is low for their length. This guide shows both patterns with real numbers.
What a low percentile means
At the 5th percentile, 5 in 100 healthy babies of the same age and sex weigh less and 95 weigh more. It's a rank, not a grade, and it says nothing on its own about how well your baby is fed. If a low number has you feeling at fault, see why a small baby isn't a parenting failure. Here's what the low lines mean in pounds and kilograms, computed from the official WHO data:
Boys:
| Age | 3rd | 5th | 10th | 50th (median) |
|---|---|---|---|---|
| Birth | 2.5 kg5 lb 8 oz | 2.6 kg5 lb 12 oz | 2.8 kg6 lb 1 oz | 3.3 kg7 lb 6 oz |
| 2 months | 4.4 kg9 lb 11 oz | 4.5 kg10 lb | 4.7 kg10 lb 7 oz | 5.6 kg12 lb 4 oz |
| 4 months | 5.6 kg12 lb 7 oz | 5.8 kg12 lb 12 oz | 6.0 kg13 lb 5 oz | 7.0 kg15 lb 7 oz |
| 6 months | 6.4 kg14 lb 3 oz | 6.6 kg14 lb 9 oz | 6.9 kg15 lb 3 oz | 7.9 kg17 lb 8 oz |
| 9 months | 7.2 kg15 lb 15 oz | 7.4 kg16 lb 6 oz | 7.7 kg17 lb 1 oz | 8.9 kg19 lb 10 oz |
| 12 months | 7.8 kg17 lb 5 oz | 8.1 kg17 lb 12 oz | 8.4 kg18 lb 8 oz | 9.6 kg21 lb 4 oz |
| 18 months | 8.9 kg19 lb 9 oz | 9.1 kg20 lb 1 oz | 9.5 kg20 lb 15 oz | 10.9 kg24 lb 2 oz |
| 2 years | 9.8 kg21 lb 10 oz | 10.1 kg22 lb 3 oz | 10.5 kg23 lb 2 oz | 12.2 kg26 lb 13 oz |
Girls:
| Age | 3rd | 5th | 10th | 50th (median) |
|---|---|---|---|---|
| Birth | 2.4 kg5 lb 6 oz | 2.5 kg5 lb 9 oz | 2.7 kg5 lb 14 oz | 3.2 kg7 lb 2 oz |
| 2 months | 4.0 kg8 lb 13 oz | 4.1 kg9 lb 2 oz | 4.3 kg9 lb 9 oz | 5.1 kg11 lb 5 oz |
| 4 months | 5.1 kg11 lb 3 oz | 5.2 kg11 lb 9 oz | 5.5 kg12 lb 1 oz | 6.4 kg14 lb 3 oz |
| 6 months | 5.8 kg12 lb 13 oz | 6.0 kg13 lb 3 oz | 6.2 kg13 lb 12 oz | 7.3 kg16 lb 1 oz |
| 9 months | 6.6 kg14 lb 8 oz | 6.8 kg14 lb 14 oz | 7.0 kg15 lb 9 oz | 8.2 kg18 lb 2 oz |
| 12 months | 7.1 kg15 lb 12 oz | 7.3 kg16 lb 3 oz | 7.7 kg16 lb 14 oz | 8.9 kg19 lb 12 oz |
| 18 months | 8.2 kg18 lb | 8.4 kg18 lb 8 oz | 8.8 kg19 lb 5 oz | 10.2 kg22 lb 9 oz |
| 2 years | 9.2 kg20 lb 3 oz | 9.4 kg20 lb 12 oz | 9.8 kg21 lb 11 oz | 11.5 kg25 lb 5 oz |
A baby between the 3rd and 15th lines is smaller than most babies and still inside the range healthy babies cover. One wrinkle: some definitions of failure to thrive start below the 5th percentile (AAFP), so a baby near that line can expect their pediatrician to look closely at the trend. For percentiles in general, see what your baby's percentile means.
GrowthKit for iPhone
Plot every measurement on the WHO charts.
Percentiles, growth velocity and a PDF for your pediatrician. Free to download, with a free trial.

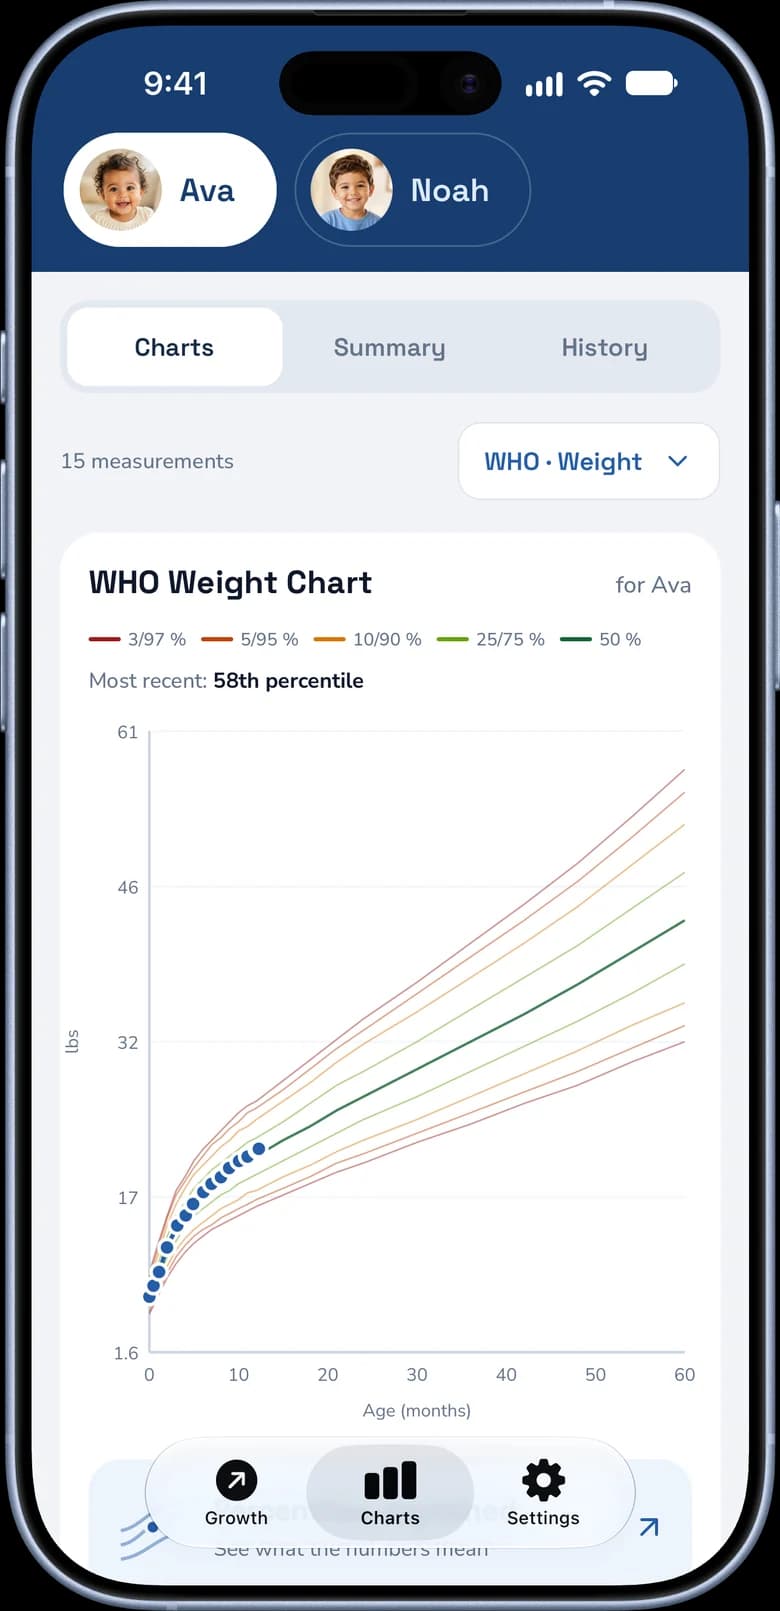
Steady low line vs a drop across two major lines
Two boys can weigh exactly the same on their first birthday and tell very different stories.
A steady low line. This boy has followed the 5th percentile since birth:
Weight-for-age, boys, birth to 12 months
He was born at 2.6 kg (5 lb 12 oz), the 5th percentile. At 6 months he weighs 6.6 kg (14 lb 9 oz), the 5th, and at 12 months 8.0 kg (17 lb 10 oz), the 4th. His curve runs parallel to the printed lines. If his length and head size are tracking too, and he's feeding well and meeting milestones, he's a small baby growing normally.
A drop across two major lines. This boy was born near the middle of the chart:
Weight-for-age, boys, birth to 12 months
He's at the 52nd percentile at 2 months, the 19th at 6 months and the 7th at 9 months. On his first birthday he weighs the same 8.0 kg as the first boy, the 4th percentile. Every weight is above the 3rd line, but he has fallen across the 50th and 15th lines. Crossing two major lines is the usual trigger for an evaluation (AAFP), so he needs a weight check and a feeding review now, not at the next routine visit.
In z-score terms, the first boy stays near −1.7 all year, while the second falls from about 0 to −1.7. The causes of a drop and what happens next are covered in baby dropped on the growth chart.
Free tool
Baby Growth Chart Calculator
Plot several of your baby's measurements on the WHO chart to see whether they follow a line or cross them.
Is the weight in proportion to length and head size?
When a baby isn't getting enough nutrition, weight is affected first, then length, then head size (AAFP). That's why pediatricians compare all three. Under age 2 they also use weight-for-length, which compares weight with the baby's own length rather than age (WHO). It's checked at well visits through 18 months (AAP Bright Futures).
Two 9-month-old girls both weigh 6.8 kg (15 lb), the 6th percentile for weight:
- The first is also short: 66.5 cm (26.2 in), the 7th percentile for length. Her weight-for-length is the 17th percentile. She's small all over and in proportion.
- The second is average length: 70.5 cm (27.8 in), the 56th percentile. Her weight-for-length is the 1st percentile, below the 2nd line. Same weight, but she's light for her length, and her pediatrician will want to review feeding.
Head circumference is measured at every well visit through 24 months. A small head that follows its own line in a small family is usually fine. A head that's falling across lines is worth raising with your pediatrician soon, whatever the weight is doing.
Free tool
Baby Weight-for-Length Calculator
Enter your baby's weight and length to see their WHO weight-for-length percentile.
Why some babies are small
Small parents. Babies tend to settle toward the size their genes set. In the first 18 months, many shift up or down ("catch-up" or "catch-down" growth), and by 18 to 24 months most have reached their genetically determined percentile (AAFP). A baby on the 10th percentile with two short parents is often right where you'd expect. Pediatricians estimate a child's target from the mid-parental height: for boys, (mother's height + father's height + 13 cm) ÷ 2; for girls, (mother's height + father's height − 13 cm) ÷ 2. See predicting a child's adult height.
Born small for gestational age (SGA). About 90% of babies born small for their gestational age catch up, mostly in the first 2 years, and those who don't are followed in a growth clinic (Clayton et al., 2007). See low birth weight babies and catch-up growth.
Born early. Preterm babies are plotted by corrected age (actual age minus the weeks born early) through age 2 (AAP). A girl born at 32 weeks (8 weeks early) who is 6 months old and weighs 5.8 kg (12 lb 13 oz) is at the 3rd percentile by actual age, but the 17th by her corrected age of about 4 months. Plotted by actual age, a healthy preemie looks much smaller than she is. See the premature baby growth chart guide.
Ethnicity. Parents often wonder whether a low percentile reflects their family's background. In the study behind the WHO standards, healthy babies in Brazil, Ghana, India, Norway, Oman and the US grew strikingly alike: only about 3% of the variation in length came from the study site, compared with 70% from differences between individual children (WHO MGRS). The WHO concluded its standards apply to children everywhere, regardless of ethnicity (WHO MGRS, 2006). Ancestry alone isn't expected to put a baby on a low line; your own family's size is the more useful clue.
What your pediatrician checks
A small baby who is growing steadily usually needs nothing beyond routine visits. When a pediatrician does take a closer look, it usually covers (AAFP):
- Re-measuring: an undressed weight on a calibrated scale and a careful lying-down length.
- The whole curve: weight, length and head size across visits, plus weight-for-length, using corrected age for preemies.
- Birth and family history: birth weight, gestational age and both parents' heights.
- Feeding and diapers: how often and how much your baby eats, and how many wet diapers they have.
- Development and an exam: milestones and any signs of illness.
Routine lab tests and hospital stays are rarely needed (AAFP). If weight gain turns out to be the problem, our guide to failure to thrive explains how it's defined and treated.
When a low percentile needs a call
| What you see | What to do |
|---|---|
| Weight, length and head size follow steady low lines, in proportion; your baby feeds well and is meeting milestones | Usually normal: keep to routine well-child visits |
| Weight is steady but below the 5th percentile, or the weight and length percentiles are far apart | Mention it at the next visit and ask about weight-for-length |
| Weight has drifted down across one major line | Mention it at the next visit; a repeat weight is often all that's needed |
| Weight or weight-for-length is newly below the line labeled 2nd (the 2.3rd percentile), or head size is falling across lines | Call your pediatrician to arrange a check before the next routine visit |
| Weight has fallen across two major lines, is lower than at the last weigh-in outside a short illness, or your newborn isn't back to birth weight by 2 weeks; or your baby is feeding poorly or has fewer wet diapers | Call your pediatrician today |
| Very few wet diapers (only 1–2 a day), sunken eyes or soft spot, very sleepy or hard to wake, or green vomit | Seek care right away |
Sources: AAFP: Failure to Thrive (2016); CDC; AAP: First Month Growth; AAP: Dehydration; AAP: Vomiting.
When you talk to your pediatrician, bring specific numbers: "He was at the 5th percentile at 2 months and is still there at 9." A small baby on a steady line is a different conversation from a baby who has slid down to the same spot. To see which pattern your own baby's numbers show, plot their dated weights against the WHO lines. For a by-age list of weight red flags, see when to worry about baby weight, and for the opposite question, baby always in a high percentile.