The tables below are the full WHO weight-for-age percentile charts for boys and girls, month by month from birth to 24 months. Find your baby's age, then see which percentile columns their weight falls between. At 12 months, for example, the 50th percentile is 9.6 kg (21 lb 4 oz) for boys and 8.9 kg (19 lb 12 oz) for girls, and the normal range for boys runs from 7.8 kg (17 lb 5 oz) (3rd percentile) to 11.8 kg (26 lb 1 oz) (97th).
These are the WHO Child Growth Standards, which the CDC recommends for all US babies from birth to age 2. Every value is computed from the official WHO data.
Baby boy weight percentile chart: birth to 24 months
The columns are the five lines on WHO's own charts: the 3rd, 15th, 50th (median), 85th and 97th percentiles.
| Age | 3rd | 15th | 50th (median) | 85th | 97th |
|---|---|---|---|---|---|
| Birth | 2.5 kg5 lb 8 oz | 2.9 kg6 lb 5 oz | 3.3 kg7 lb 6 oz | 3.9 kg8 lb 9 oz | 4.3 kg9 lb 9 oz |
| 1 month | 3.4 kg7 lb 10 oz | 3.9 kg8 lb 9 oz | 4.5 kg9 lb 14 oz | 5.1 kg11 lb 5 oz | 5.7 kg12 lb 9 oz |
| 2 months | 4.4 kg9 lb 11 oz | 4.9 kg10 lb 12 oz | 5.6 kg12 lb 4 oz | 6.3 kg13 lb 15 oz | 7.0 kg15 lb 7 oz |
| 3 months | 5.1 kg11 lb 4 oz | 5.6 kg12 lb 7 oz | 6.4 kg14 lb 1 oz | 7.2 kg15 lb 14 oz | 7.9 kg17 lb 7 oz |
| 4 months | 5.6 kg12 lb 7 oz | 6.2 kg13 lb 11 oz | 7.0 kg15 lb 7 oz | 7.9 kg17 lb 5 oz | 8.6 kg19 lb 1 oz |
| 5 months | 6.1 kg13 lb 6 oz | 6.7 kg14 lb 12 oz | 7.5 kg16 lb 9 oz | 8.4 kg18 lb 9 oz | 9.2 kg20 lb 5 oz |
| 6 months | 6.4 kg14 lb 3 oz | 7.1 kg15 lb 10 oz | 7.9 kg17 lb 8 oz | 8.9 kg19 lb 9 oz | 9.7 kg21 lb 7 oz |
| 7 months | 6.7 kg14 lb 14 oz | 7.4 kg16 lb 5 oz | 8.3 kg18 lb 5 oz | 9.3 kg20 lb 7 oz | 10.2 kg22 lb 6 oz |
| 8 months | 7.0 kg15 lb 7 oz | 7.7 kg16 lb 15 oz | 8.6 kg19 lb | 9.6 kg21 lb 4 oz | 10.5 kg23 lb 4 oz |
| 9 months | 7.2 kg15 lb 15 oz | 7.9 kg17 lb 8 oz | 8.9 kg19 lb 10 oz | 10.0 kg21 lb 15 oz | 10.9 kg24 lb 1 oz |
| 10 months | 7.5 kg16 lb 7 oz | 8.2 kg18 lb 1 oz | 9.2 kg20 lb 3 oz | 10.3 kg22 lb 10 oz | 11.2 kg24 lb 12 oz |
| 11 months | 7.7 kg16 lb 14 oz | 8.4 kg18 lb 8 oz | 9.4 kg20 lb 12 oz | 10.5 kg23 lb 4 oz | 11.5 kg25 lb 7 oz |
| 12 months | 7.8 kg17 lb 5 oz | 8.6 kg19 lb | 9.6 kg21 lb 4 oz | 10.8 kg23 lb 13 oz | 11.8 kg26 lb 1 oz |
| 13 months | 8.0 kg17 lb 11 oz | 8.8 kg19 lb 7 oz | 9.9 kg21 lb 12 oz | 11.1 kg24 lb 6 oz | 12.1 kg26 lb 11 oz |
| 14 months | 8.2 kg18 lb 1 oz | 9.0 kg19 lb 14 oz | 10.1 kg22 lb 4 oz | 11.3 kg24 lb 15 oz | 12.4 kg27 lb 5 oz |
| 15 months | 8.4 kg18 lb 7 oz | 9.2 kg20 lb 4 oz | 10.3 kg22 lb 12 oz | 11.6 kg25 lb 8 oz | 12.7 kg27 lb 15 oz |
| 16 months | 8.5 kg18 lb 13 oz | 9.4 kg20 lb 11 oz | 10.5 kg23 lb 3 oz | 11.8 kg26 lb | 12.9 kg28 lb 9 oz |
| 17 months | 8.7 kg19 lb 3 oz | 9.6 kg21 lb 1 oz | 10.7 kg23 lb 11 oz | 12.0 kg26 lb 9 oz | 13.2 kg29 lb 2 oz |
| 18 months | 8.9 kg19 lb 9 oz | 9.7 kg21 lb 8 oz | 10.9 kg24 lb 2 oz | 12.3 kg27 lb 1 oz | 13.5 kg29 lb 11 oz |
| 19 months | 9.0 kg19 lb 15 oz | 9.9 kg21 lb 14 oz | 11.1 kg24 lb 9 oz | 12.5 kg27 lb 9 oz | 13.7 kg30 lb 5 oz |
| 20 months | 9.2 kg20 lb 4 oz | 10.1 kg22 lb 4 oz | 11.3 kg25 lb | 12.7 kg28 lb 2 oz | 14.0 kg30 lb 14 oz |
| 21 months | 9.3 kg20 lb 10 oz | 10.3 kg22 lb 10 oz | 11.5 kg25 lb 7 oz | 13.0 kg28 lb 10 oz | 14.3 kg31 lb 7 oz |
| 22 months | 9.5 kg20 lb 15 oz | 10.5 kg23 lb 1 oz | 11.8 kg25 lb 14 oz | 13.2 kg29 lb 2 oz | 14.5 kg32 lb 1 oz |
| 23 months | 9.7 kg21 lb 4 oz | 10.6 kg23 lb 7 oz | 12.0 kg26 lb 6 oz | 13.4 kg29 lb 10 oz | 14.8 kg32 lb 10 oz |
| 2 years | 9.8 kg21 lb 10 oz | 10.8 kg23 lb 13 oz | 12.2 kg26 lb 13 oz | 13.7 kg30 lb 3 oz | 15.1 kg33 lb 4 oz |
Weight-for-age percentiles, boys, birth to 24 months (WHO)
Baby girl weight percentile chart: birth to 24 months
| Age | 3rd | 15th | 50th (median) | 85th | 97th |
|---|---|---|---|---|---|
| Birth | 2.4 kg5 lb 6 oz | 2.8 kg6 lb 2 oz | 3.2 kg7 lb 2 oz | 3.7 kg8 lb 4 oz | 4.2 kg9 lb 3 oz |
| 1 month | 3.2 kg7 lb 1 oz | 3.6 kg8 lb | 4.2 kg9 lb 4 oz | 4.8 kg10 lb 10 oz | 5.4 kg11 lb 14 oz |
| 2 months | 4.0 kg8 lb 13 oz | 4.5 kg9 lb 14 oz | 5.1 kg11 lb 5 oz | 5.9 kg12 lb 15 oz | 6.5 kg14 lb 6 oz |
| 3 months | 4.6 kg10 lb 2 oz | 5.1 kg11 lb 5 oz | 5.8 kg12 lb 14 oz | 6.7 kg14 lb 11 oz | 7.4 kg16 lb 5 oz |
| 4 months | 5.1 kg11 lb 3 oz | 5.6 kg12 lb 7 oz | 6.4 kg14 lb 3 oz | 7.3 kg16 lb 2 oz | 8.1 kg17 lb 14 oz |
| 5 months | 5.5 kg12 lb 1 oz | 6.1 kg13 lb 6 oz | 6.9 kg15 lb 3 oz | 7.8 kg17 lb 4 oz | 8.7 kg19 lb 3 oz |
| 6 months | 5.8 kg12 lb 13 oz | 6.4 kg14 lb 3 oz | 7.3 kg16 lb 1 oz | 8.3 kg18 lb 4 oz | 9.2 kg20 lb 4 oz |
| 7 months | 6.1 kg13 lb 7 oz | 6.7 kg14 lb 14 oz | 7.6 kg16 lb 14 oz | 8.7 kg19 lb 2 oz | 9.6 kg21 lb 4 oz |
| 8 months | 6.3 kg14 lb | 7.0 kg15 lb 7 oz | 7.9 kg17 lb 8 oz | 9.0 kg19 lb 14 oz | 10.0 kg22 lb 2 oz |
| 9 months | 6.6 kg14 lb 8 oz | 7.3 kg16 lb | 8.2 kg18 lb 2 oz | 9.3 kg20 lb 10 oz | 10.4 kg22 lb 14 oz |
| 10 months | 6.8 kg14 lb 15 oz | 7.5 kg16 lb 8 oz | 8.5 kg18 lb 11 oz | 9.6 kg21 lb 4 oz | 10.7 kg23 lb 10 oz |
| 11 months | 7.0 kg15 lb 5 oz | 7.7 kg16 lb 15 oz | 8.7 kg19 lb 4 oz | 9.9 kg21 lb 14 oz | 11.0 kg24 lb 5 oz |
| 12 months | 7.1 kg15 lb 12 oz | 7.9 kg17 lb 6 oz | 8.9 kg19 lb 12 oz | 10.2 kg22 lb 7 oz | 11.3 kg25 lb |
| 13 months | 7.3 kg16 lb 2 oz | 8.1 kg17 lb 13 oz | 9.2 kg20 lb 3 oz | 10.4 kg23 lb | 11.6 kg25 lb 10 oz |
| 14 months | 7.5 kg16 lb 8 oz | 8.3 kg18 lb 4 oz | 9.4 kg20 lb 11 oz | 10.7 kg23 lb 9 oz | 11.9 kg26 lb 4 oz |
| 15 months | 7.7 kg16 lb 14 oz | 8.5 kg18 lb 11 oz | 9.6 kg21 lb 3 oz | 10.9 kg24 lb 1 oz | 12.2 kg26 lb 14 oz |
| 16 months | 7.8 kg17 lb 4 oz | 8.7 kg19 lb 1 oz | 9.8 kg21 lb 10 oz | 11.2 kg24 lb 10 oz | 12.5 kg27 lb 7 oz |
| 17 months | 8.0 kg17 lb 10 oz | 8.8 kg19 lb 8 oz | 10.0 kg22 lb 2 oz | 11.4 kg25 lb 2 oz | 12.7 kg28 lb 1 oz |
| 18 months | 8.2 kg18 lb | 9.0 kg19 lb 14 oz | 10.2 kg22 lb 9 oz | 11.6 kg25 lb 11 oz | 13.0 kg28 lb 10 oz |
| 19 months | 8.3 kg18 lb 6 oz | 9.2 kg20 lb 5 oz | 10.4 kg23 lb | 11.9 kg26 lb 3 oz | 13.3 kg29 lb 4 oz |
| 20 months | 8.5 kg18 lb 12 oz | 9.4 kg20 lb 11 oz | 10.6 kg23 lb 8 oz | 12.1 kg26 lb 12 oz | 13.5 kg29 lb 13 oz |
| 21 months | 8.7 kg19 lb 2 oz | 9.6 kg21 lb 2 oz | 10.9 kg23 lb 15 oz | 12.4 kg27 lb 4 oz | 13.8 kg30 lb 7 oz |
| 22 months | 8.8 kg19 lb 8 oz | 9.8 kg21 lb 8 oz | 11.1 kg24 lb 6 oz | 12.6 kg27 lb 13 oz | 14.1 kg31 lb |
| 23 months | 9.0 kg19 lb 13 oz | 9.9 kg21 lb 14 oz | 11.3 kg24 lb 13 oz | 12.8 kg28 lb 5 oz | 14.3 kg31 lb 10 oz |
| 2 years | 9.2 kg20 lb 3 oz | 10.1 kg22 lb 5 oz | 11.5 kg25 lb 5 oz | 13.1 kg28 lb 13 oz | 14.6 kg32 lb 3 oz |
Weight-for-age percentiles, girls, birth to 24 months (WHO)
GrowthKit for iPhone
Plot every measurement on the WHO charts.
Percentiles, growth velocity and a PDF for your pediatrician. Free to download, with a free trial.

How to find your baby's percentile: a worked example
- Pick the table for your baby's sex.
- Find the row for their age. If they're between months, use the nearer row, or a calculator for an exact answer.
- See which two columns their weight falls between.
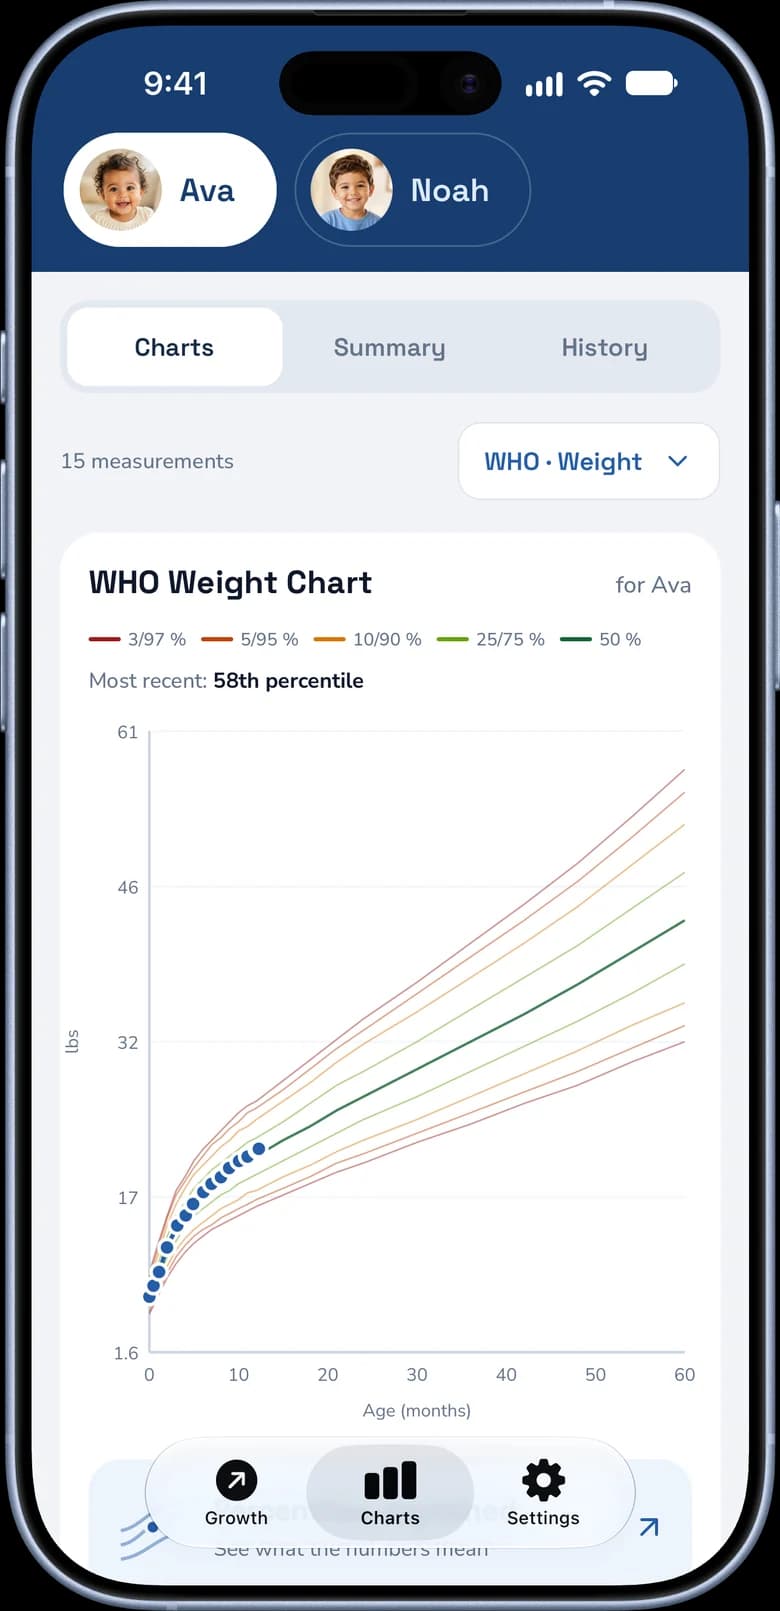
Say your daughter is 6 months old and weighs 7.2 kg (15 lb 14 oz). In the girls' table at 6 months, that sits just under the median, and the exact figure is the 46th percentile. Out of 100 healthy 6-month-old girls, about that many would weigh less than her.
A 9-month-old boy who weighs 20 lb (9.07 kg) is at the 57th percentile, slightly above the middle of the range.
Tables only give five lines, and babies are rarely an exact number of months old. For a precise result, enter your baby's age in months (with a decimal) and weight:
Free tool
Baby Weight Percentile Calculator
Enter age, sex and weight to get your baby's exact WHO weight-for-age percentile.
What the percentile lines mean
A percentile is a comparison, not a score. The 25th percentile means about 25 in 100 healthy babies of the same age and sex weigh less, and 75 weigh more. The 3rd to 97th percentile lines contain 94% of healthy babies, and a baby can be thriving anywhere in that band. If your baby is near the bottom of it, see when a low weight percentile is a concern.
Two details are worth knowing when you look at your pediatrician's chart:
- The lines may differ from these tables. WHO's own charts show the 3rd, 15th, 50th, 85th and 97th percentiles. The US versions of the WHO charts include lines labelled 2nd and 98th. These are really the 2.3rd and 97.7th percentiles, which the CDC recommends for flagging unusually low or high growth under age 2. For a 6-month-old girl, those two lines sit at 5.7 kg (12 lb 10 oz) and 9.3 kg (20 lb 9 oz).
- The trend matters more than any one dot. Pediatricians look at whether your baby follows roughly the same line. Falling across two major percentile lines is the usual trigger for a closer look (AAFP). Some shifting in the first months is common, especially in babies who were big or small at birth.
For a fuller explanation, including why the 50th percentile isn't a target, see what your baby's percentile means and our guide to reading a growth chart.
Why boys and girls have separate charts
Boys are heavier than girls at every age. The median newborn boy weighs 3.3 kg (7 lb 6 oz) and the median newborn girl 3.2 kg (7 lb 2 oz). By 12 months the gap is wider: 9.6 kg (21 lb 4 oz) versus 8.9 kg (19 lb 12 oz).
Using the wrong chart gives a misleading answer. A 12-month-old girl weighing 8.9 kg is at the 48th percentile on the girls' chart, right in the middle. Plotted on the boys' chart, the same weight looks like the 23rd percentile.
WHO or CDC: which chart is your baby on?
In the US, pediatricians use the WHO charts from birth to 24 months and switch to the CDC charts at age 2 (CDC). The two can give quite different percentiles for the same baby:
- The WHO charts are a standard. They describe how healthy children should grow in good conditions, with the healthy breastfed baby as the model. The data came from six sites in Brazil, Ghana, India, Norway, Oman and the US.
- The CDC charts are a reference. They describe how US children grew between 1963 and 1994. The CDC reference labels 7–11% of children aged 6–23 months as low weight for age, compared with under 3% on the WHO standard (CDC MMWR).
- Feeding affects the curve. Formula-fed babies tend to gain weight faster than the WHO curves after about 3 months, so they may drift upward on the chart. Slower gain in breastfed babies between 3 and 18 months is normal.
For a side-by-side comparison, see WHO vs CDC growth charts. For weights after the second birthday, use the toddler weight and height chart.
Percentile chart or average weight?
This page gives the full percentile tables for judging where your baby sits in the normal range. If you only want the typical weight for each month, our average baby weight by month guide shows the median and normal range side by side. To check how much your baby should be gaining between visits, see baby weight gain per month.
A few related questions have their own guides:
- Born early? Plot your baby by corrected age (age counted from the due date) through age 2, or they'll look smaller than they are (AAP). See the premature baby growth chart.
- Worried about a low or falling percentile? The when to worry about baby weight guide has a by-age table of red flags, and baby dropped on the growth chart explains common causes.
- Is weight in proportion to length? That's a separate chart, weight-for-length. The baby weight-for-length calculator checks it.