On the WHO growth charts that US pediatricians use from birth to age 2, the median baby boy weighs 7.9 kg (17 lb 8 oz) at 6 months and 9.6 kg (21 lb 4 oz) at 12 months. The median girl weighs 7.3 kg (16 lb 1 oz) and 8.9 kg (19 lb 12 oz). In the first year, a typical baby gains about 6 kg (13 lb), grows about 25 cm (10 in) and adds 11–12 cm to their head circumference.
This page puts weight, length and head size side by side at the ages that matter most, then points you to the detailed chart for each one.
Baby growth chart at a glance (birth to 24 months)
Each table shows the WHO median and the normal range (3rd to 97th percentile) for boys and girls, computed from the official WHO data. To find your own baby's exact percentiles, use our online pediatric growth chart calculators.
Weight by age
| Age | Boys: median | Boys: 3rd–97th | Girls: median | Girls: 3rd–97th |
|---|---|---|---|---|
| Birth | 3.3 kg7 lb 6 oz | 2.5 kg – 4.3 kg5 lb 8 oz – 9 lb 9 oz | 3.2 kg7 lb 2 oz | 2.4 kg – 4.2 kg5 lb 6 oz – 9 lb 3 oz |
| 3 months | 6.4 kg14 lb 1 oz | 5.1 kg – 7.9 kg11 lb 4 oz – 17 lb 7 oz | 5.8 kg12 lb 14 oz | 4.6 kg – 7.4 kg10 lb 2 oz – 16 lb 5 oz |
| 6 months | 7.9 kg17 lb 8 oz | 6.4 kg – 9.7 kg14 lb 3 oz – 21 lb 7 oz | 7.3 kg16 lb 1 oz | 5.8 kg – 9.2 kg12 lb 13 oz – 20 lb 4 oz |
| 9 months | 8.9 kg19 lb 10 oz | 7.2 kg – 10.9 kg15 lb 15 oz – 24 lb 1 oz | 8.2 kg18 lb 2 oz | 6.6 kg – 10.4 kg14 lb 8 oz – 22 lb 14 oz |
| 12 months | 9.6 kg21 lb 4 oz | 7.8 kg – 11.8 kg17 lb 5 oz – 26 lb 1 oz | 8.9 kg19 lb 12 oz | 7.1 kg – 11.3 kg15 lb 12 oz – 25 lb |
| 18 months | 10.9 kg24 lb 2 oz | 8.9 kg – 13.5 kg19 lb 9 oz – 29 lb 11 oz | 10.2 kg22 lb 9 oz | 8.2 kg – 13.0 kg18 lb – 28 lb 10 oz |
| 2 years | 12.2 kg26 lb 13 oz | 9.8 kg – 15.1 kg21 lb 10 oz – 33 lb 4 oz | 11.5 kg25 lb 5 oz | 9.2 kg – 14.6 kg20 lb 3 oz – 32 lb 3 oz |
For every month from birth to 24 months, see average baby weight by month. For all five percentile lines at each age, see the baby weight percentile chart.
Length by age
| Age | Boys: median | Boys: 3rd–97th | Girls: median | Girls: 3rd–97th |
|---|---|---|---|---|
| Birth | 49.9 cm19.6 in | 46.3 cm – 53.4 cm18.2 in – 21.0 in | 49.1 cm19.3 in | 45.6 cm – 52.7 cm18.0 in – 20.7 in |
| 3 months | 61.4 cm24.2 in | 57.6 cm – 65.3 cm22.7 in – 25.7 in | 59.8 cm23.5 in | 55.8 cm – 63.8 cm22.0 in – 25.1 in |
| 6 months | 67.6 cm26.6 in | 63.6 cm – 71.6 cm25.0 in – 28.2 in | 65.7 cm25.9 in | 61.5 cm – 70.0 cm24.2 in – 27.6 in |
| 9 months | 72.0 cm28.3 in | 67.7 cm – 76.2 cm26.7 in – 30.0 in | 70.1 cm27.6 in | 65.6 cm – 74.7 cm25.8 in – 29.4 in |
| 12 months | 75.7 cm29.8 in | 71.3 cm – 80.2 cm28.1 in – 31.6 in | 74.0 cm29.1 in | 69.2 cm – 78.9 cm27.2 in – 31.0 in |
| 18 months | 82.3 cm32.4 in | 77.2 cm – 87.3 cm30.4 in – 34.4 in | 80.7 cm31.8 in | 75.2 cm – 86.2 cm29.6 in – 33.9 in |
| 2 years | 87.8 cm34.6 in | 82.1 cm – 93.5 cm32.3 in – 36.8 in | 86.4 cm34.0 in | 80.3 cm – 92.5 cm31.6 in – 36.4 in |
Babies are measured lying down until age 2. Monthly values, growth per month and the switch to standing height are in average baby height by month.
Head circumference by age
| Age | Boys: median | Boys: 3rd–97th | Girls: median | Girls: 3rd–97th |
|---|---|---|---|---|
| Birth | 34.5 cm13.6 in | 32.1 cm – 36.9 cm12.6 in – 14.5 in | 33.9 cm13.3 in | 31.7 cm – 36.1 cm12.5 in – 14.2 in |
| 3 months | 40.5 cm16.0 in | 38.3 cm – 42.7 cm15.1 in – 16.8 in | 39.5 cm15.6 in | 37.2 cm – 41.9 cm14.6 in – 16.5 in |
| 6 months | 43.3 cm17.1 in | 41.0 cm – 45.6 cm16.2 in – 18.0 in | 42.2 cm16.6 in | 39.7 cm – 44.6 cm15.6 in – 17.6 in |
| 9 months | 45.0 cm17.7 in | 42.6 cm – 47.4 cm16.8 in – 18.6 in | 43.8 cm17.3 in | 41.3 cm – 46.3 cm16.3 in – 18.2 in |
| 12 months | 46.1 cm18.1 in | 43.6 cm – 48.5 cm17.2 in – 19.1 in | 44.9 cm17.7 in | 42.3 cm – 47.5 cm16.7 in – 18.7 in |
| 18 months | 47.4 cm18.7 in | 44.9 cm – 49.9 cm17.7 in – 19.6 in | 46.2 cm18.2 in | 43.6 cm – 48.8 cm17.2 in – 19.2 in |
| 2 years | 48.3 cm19.0 in | 45.7 cm – 50.8 cm18.0 in – 20.0 in | 47.2 cm18.6 in | 44.6 cm – 49.8 cm17.5 in – 19.6 in |
Head size is measured at well-child visits through age 2. Full percentile tables to 3 years, head growth per month and what a small or large head can mean are in the baby head circumference chart. For macrocephaly and microcephaly specifically, see when a baby's head is too big or too small.
GrowthKit for iPhone
Plot every measurement on the WHO charts.
Percentiles, growth velocity and a PDF for your pediatrician. Free to download, with a free trial.

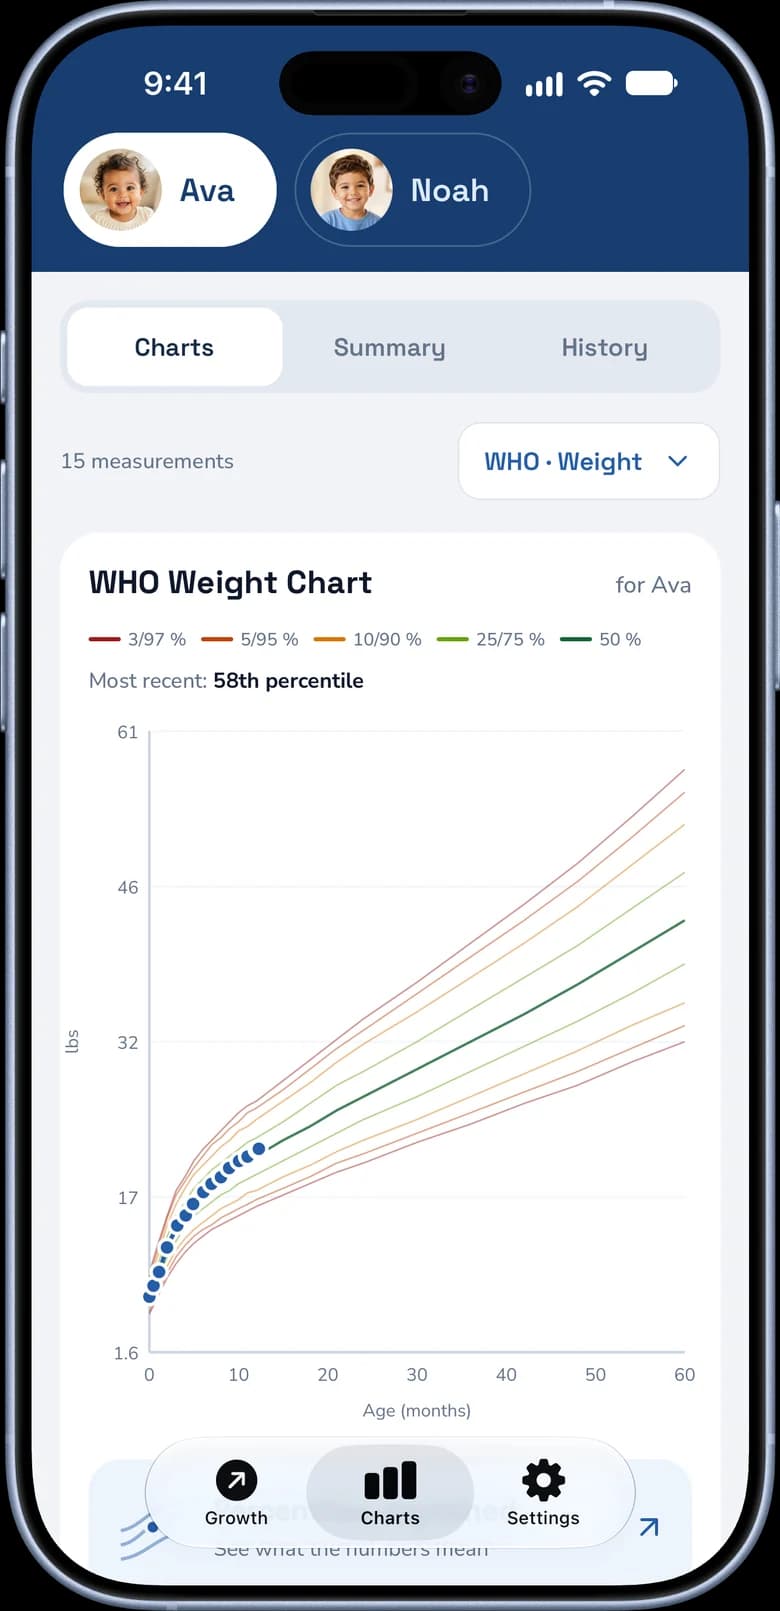
Which growth chart does your pediatrician use?
In the US, pediatricians use the WHO growth standards from birth to 24 months and the CDC growth charts from age 2 (CDC). The WHO standards describe how healthy, mostly breastfed babies in six countries grew under good conditions. The CDC charts describe US children. For how feeding type shows up on the curve, see breastfed vs. formula-fed baby growth.
The two charts draw different percentile lines:
- WHO charts: 3rd, 15th, 50th, 85th and 97th. US versions of the WHO charts print the 2nd and 98th lines (really the 2.3rd and 97.7th) as the cutoffs the CDC recommends for flagging unusually low or high growth.
- CDC charts: 5th, 10th, 25th, 50th, 75th, 90th and 95th.
That matters when you count "lines crossed": two lines on a CDC chart can be much less distance than two lines on a WHO chart. Our WHO vs. CDC growth chart guide explains the differences in detail.
How to read a baby growth chart
A percentile tells you how your baby compares with other babies of the same age and sex. A baby at the 40th percentile for weight weighs more than about 40 out of 100 babies their age. It's a position, not a grade: the 10th percentile is as healthy as the 90th. If your baby sits on a low line, see when a small baby is too small.
What pediatricians care about most is the trend. Here is a boy who stays close to one line from birth to 2 years:
Weight-for-age, boys, birth to 2 years
He weighs 3.4 kg at birth (54th percentile), 7.8 kg at 6 months (44th), 9.5 kg at 12 months (44th) and 12.0 kg at 2 years (46th). The numbers rise quickly, but his position barely moves. That's healthy growth. To see your own baby's trend the same way, plot their dated measurements on the WHO chart.
The pattern that gets a closer look is a baby who crosses two major percentile lines, up or down (AAFP). On a WHO chart, a baby who slides from above the 50th line to below the 15th line has crossed two. Our guide on how to read a child growth chart walks through more examples, and what your baby's percentile means covers the basics.
Free tool
Baby Weight Percentile Calculator
Enter your baby's age, sex and weight to see their exact WHO percentile.
Detailed growth charts by age and measurement
| If you want to know… | Read |
|---|---|
| Average weight for every month, 0–24 months | Average baby weight by month |
| All weight percentile lines, boys and girls | Baby weight percentile chart |
| How much weight babies gain each month | Baby weight gain per month |
| Average length for every month and the switch to height | Average baby height by month |
| Head size percentiles and head growth, 0–3 years | Baby head circumference chart |
| Weight and height from 1 to 5 years | Toddler weight and height chart |
| Height, weight and BMI percentiles from 2 to 12 years | Children's growth percentile chart |
| How to plot a baby born early | Premature baby growth chart |
| How to read percentile curves | How to read a child growth chart |
| What a z-score (SD score) on a chart means | Z-scores on a growth chart |
| Why WHO and CDC give different percentiles | WHO vs. CDC growth charts |
| A quick check across weight, length and head size | Is my baby growing normally? |
What's normal on a baby growth chart
Several patterns worry parents but are usually normal:
- Weight loss in the first days. All newborns lose some weight after birth. Most are back to birth weight by about 2 weeks, and almost all by 3 weeks (AAP).
- Shifting percentiles in the first 2 years. Birth size partly reflects conditions in the womb. About two-thirds of children shift percentiles steadily until they reach their genetic channel, and most have settled there by 18–24 months (AAFP).
- Weight, length and head on different percentiles. Children come in different builds. A baby at the 30th percentile for weight and the 70th for length may simply be long and lean. Your pediatrician checks proportion with weight-for-length.
- Slower gain after 6 months. Monthly gains shrink steadily through the first year. See baby weight gain per month for how much.
- Prematurity. Babies born early are plotted by corrected age (age counted from the due date) through age 2 (AAP).
Do chubby babies become overweight children?
Not necessarily. Plenty of big babies slim down as they start moving. But fast early growth isn't meaningless either. In a UK study of 848 children, the roughly 30% who gained weight much faster than their starting curve between birth and age 2 were heavier and had more body fat at age 5 (Ong et al., BMJ). That's why a baby climbing steadily across percentile lines is worth discussing, just like one falling across them.
When to call your pediatrician
| Situation | What to do |
|---|---|
| Your newborn lost 10% or more of birth weight, or isn't back to birth weight by 2 weeks | Call your pediatrician now |
| Weight, length or head size has fallen (or climbed) across two major percentile lines | Call and book a growth check |
| A measurement is below the 2nd or above the 98th percentile line | Ask at the next visit (sooner if it's new) |
| Your baby is losing weight outside of a short illness, or isn't feeding well | Call your pediatrician the same day |
| Your baby's soft spot bulges while they're calm and upright | Seek emergency care now |
| Measurements follow steady lines, even low or high ones | Usually nothing to do; keep tracking at well-child visits |
The 2nd and 98th percentile lines on US WHO charts are the 2.3rd and 97.7th percentiles (CDC). For more on concerning weight patterns, see when to worry about baby weight.
GrowthKit plots weight, length and head circumference on the same WHO charts and shows the exact percentile for each measurement, so you can see the trend between visits.
Free tool
Baby Height Percentile Calculator
Enter your baby's age, sex and length to see their WHO length percentile.